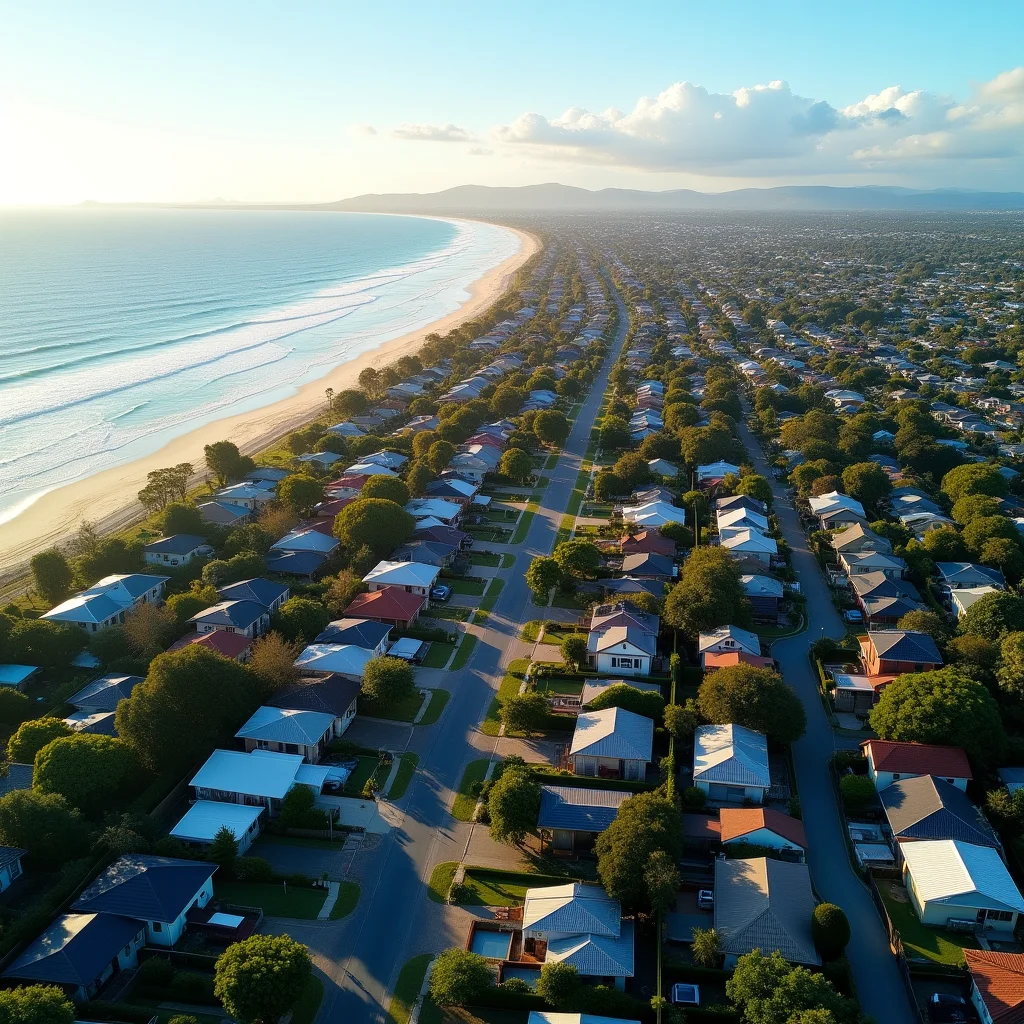
According to realestate.com.au, 180 suburbs across Queensland still carry a median house or unit price under $500,000, even as the state's capital and south-east corridor have posted strong price growth in recent years. The finding lands at an awkward moment for affordability narratives, with median dwelling values in Brisbane and the Gold Coast having moved well past the half-million-dollar mark.
Where the Sub-$500k Pockets Remain
The 180 suburbs identified by realestate.com.au span regional and outer-ring Queensland, spotlighting pockets of the state that have largely sat outside the broader price boom. These are not isolated one-off listings but entire suburb medians sitting below $500,000, a threshold that has become increasingly rare in south-east Queensland's inner and middle rings. The spread suggests affordability in Queensland is now a story of geography as much as it is a story of dwelling type, with buyers needing to look well beyond the traditional Brisbane-Gold Coast-Sunshine Coast triangle to find genuine entry-level stock.
For additional market context, see WealthWatchPro investment market analysis.
This matters because Queensland has been positioned nationally as the beneficiary of the interstate migration wave out of Sydney and Melbourne, pushing up prices in well-known growth corridors. The persistence of 180 suburbs under $500,000 indicates that migration-driven demand has not been evenly distributed, leaving some markets under-capitalised relative to infrastructure, population growth or local economic conditions. For a state government under pressure to deliver affordable housing ahead of population targets, this list effectively maps where supply-side intervention or targeted infrastructure spending could still move the needle without competing against established boom markets.
For buyers priced out of Brisbane's inner and middle rings, this data offers a practical shortlist rather than a vague promise of "affordable Queensland". A first home buyer or investor working with a sub-$500,000 budget can now cross-reference realestate.com.au's list against transport links, planned infrastructure and rental demand before committing. The risk is that cheap median prices in some of these suburbs reflect genuine value gaps — but in others they reflect structural headwinds such as declining population, limited employment bases or oversupply of a particular dwelling type that keep prices suppressed for a reason.
The Traps Behind the Headline Number
Realestate.com.au's reporting explicitly frames these 180 suburbs with a warning about "traps to avoid", signalling that a low median price alone is not evidence of a sound buy. The traps worth watching for in this kind of list typically include thin transaction volumes that make medians volatile, strata developments with body corporate or building defect issues, and localised economic dependence on a single industry such as mining or agriculture that can swing employment and rental demand sharply.
The mechanism at play is straightforward: a suburb median is a snapshot of recent sales, and in low-volume markets a handful of transactions can distort the figure in either direction. A buyer relying purely on a headline "under $500k" tag without digging into sales history, vacancy rates and planning approvals risks buying into a market that looks cheap on paper but carries higher holding risk than an established, more expensive suburb with deeper liquidity. This is the core tension in any affordability list — the suburbs that look most attractive on price are often the ones requiring the most due diligence.
Buyers and investors assessing this list should treat the $500,000 threshold as a starting filter, not a buy signal. Running each shortlisted suburb through vacancy rate data, recent rental yield figures and local employment trends will separate suburbs with genuine upside from those where the low price reflects a structural discount. Investors in particular should be wary of chasing yield in thinly traded regional pockets without first confirming exit liquidity — a lesson relevant to anyone building a property portfolio using suburb-level transaction data rather than headline medians alone.
Context: Queensland Against the National Price Story
Queensland's affordability gap needs to be read against the broader national price divergence currently playing out. In Western Australia, South Perth has posted 13.8% annual growth and Nedlands has run 15%, according to REAStats data, even as the RBA's 4.60% cash rate squeezes borrowing capacity in Melbourne and Sydney. That contrast — booming inner-ring Perth suburbs against 180 sub-$500,000 Queensland pockets — illustrates just how fragmented the national market has become under a single cash rate setting.
A $500,000 price point that once defined entry-level Brisbane now applies to only a shrinking subset of the state, while 180 other suburbs remain stuck below that line — a split that reflects uneven migration and infrastructure flows rather than a uniform Queensland boom.
Buyers researching overseas or interstate exposure as part of a diversified strategy should also be mindful of the tax treatment that applies once a property sits outside Australia — a separate but related consideration covered in APF's Australian Tax on Overseas Property — Complete Guide. For most readers looking at this Queensland list, though, the more immediate reference point is domestic: how capital gains tax and holding costs apply to a sub-$500,000 purchase, detailed in APF's Capital Gains Tax on Australian Property guide.
What This Means for Buyers and Investors
For first home buyers, the 180-suburb list is arguably the most useful practical output of this data — it converts a vague sense that "Queensland is still affordable" into a concrete shortlist that can be tested against commute times, school catchments and five-year infrastructure plans. Buyers should prioritise suburbs with confirmed infrastructure commitments or rail/road upgrades, since these are the pockets most likely to see the sub-$500,000 window close as broader price growth eventually filters outward from Brisbane.
Investors chasing yield in these markets need to separate genuine growth corridors from static or declining regional towns. A sub-$500,000 median in a commuter suburb with rising population is a fundamentally different proposition to the same price point in a town reliant on a single mine or processing plant. Running rental yield calculations alongside vacancy data, rather than relying on price alone, remains the most reliable filter — a discipline outlined in APF's broader Australian Property Tax Guide for investors weighing holding costs against expected capital growth.
The practical takeaway for anyone acting on this list in the next six months is simple: treat $500,000 as a floor for investigation, not a ceiling on risk. Queensland's affordability gap is real, but it is not uniform, and the suburbs where it persists for structural reasons will not necessarily close that gap just because neighbouring markets have boomed. Due diligence on each specific suburb — not the state-wide average — will determine whether these 180 pockets turn out to be bargains or warnings.
This article was produced with AI assistance and reviewed for accuracy. Content is for informational purposes only and does not constitute financial or property investment advice.