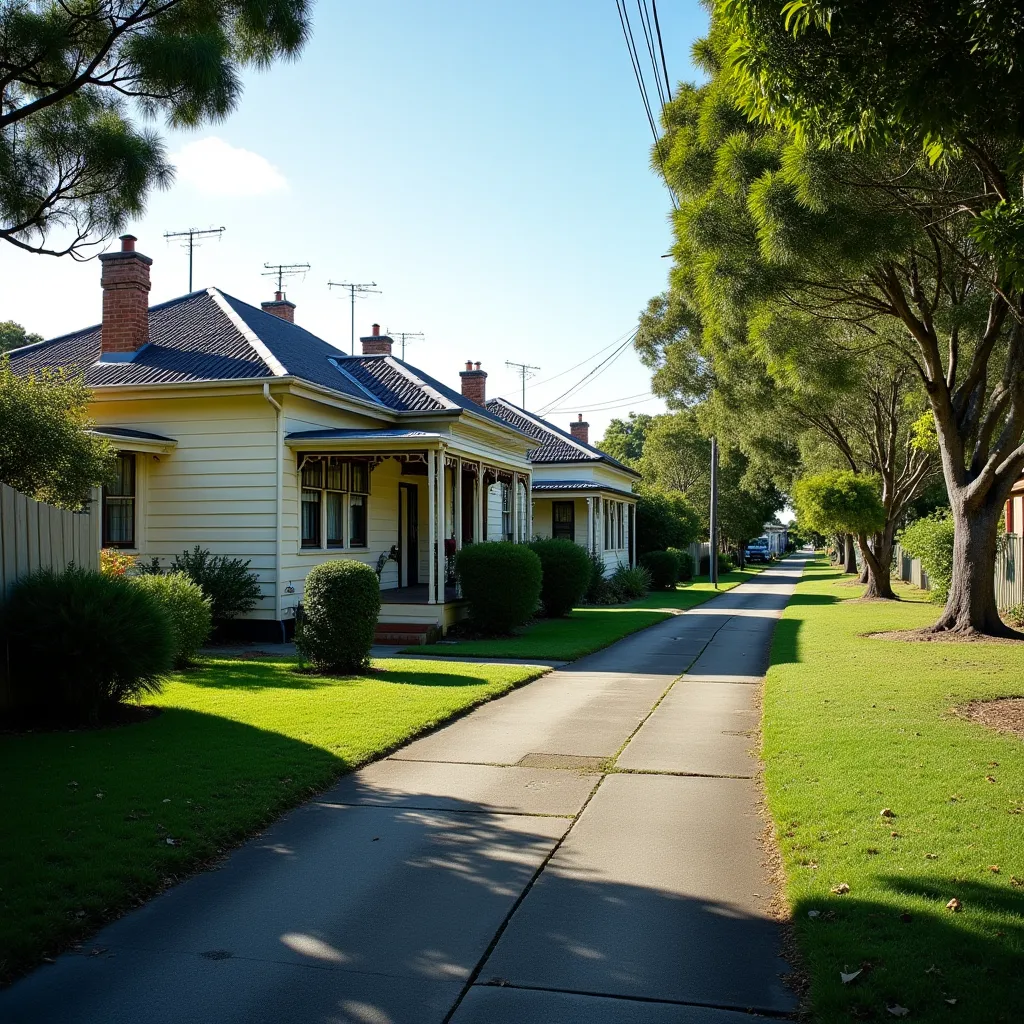
According to realestate.com.au, just 12.76 per cent of Greater Brisbane suburbs remain affordable for couples buying on two average salaries, down sharply from 43.43 per cent a year earlier. The figures, drawn from Compare the Market's upcoming Household Budget Barometer, now rank Brisbane as the hardest capital in the country for dual-income households to crack a home.
The Numbers Behind Brisbane's Fall
The Compare the Market analysis covered 3,363 suburbs nationwide, comparing estimated loan repayments against median household earnings, assuming an 80 per cent loan-to-value ratio. A suburb was classed as affordable only where repayments stayed under 30 per cent of household income. For a typical Brisbane couple on a combined median income of roughly $149,000 a year, that cap works out to around $3,741 a month — a tight ceiling against a market where a typical New Farm house now costs $3.32 million and demands repayments above $16,200 a month, according to the same realestate.com.au report.
Related reading: WealthWatchPro investment market analysis.
The collapse is striking because it runs counter to the usual affordability story. Property values have been falling in parts of the market, which should in theory open doors for buyers. Instead, Compare the Market property expert Andrew Winter said rising interest rates have wiped out any benefit from softer prices by squeezing borrowing power. In the report’s ranking, Brisbane is least affordable; Adelaide follows at 14.95 per cent of suburbs affordable, then Sydney at 16.88 per cent, and Perth at 22.11 per cent, meaning Brisbane has overtaken Sydney as the nation's toughest market for couples.
Single-income buyers fare far worse. Not one Greater Brisbane suburb was classified as affordable on an average single salary, according to the report, leaving solo buyers reliant on a large deposit or family support simply to compete. Winter noted these buyers are now forced into the cheapest units, competing directly with couples who have themselves been priced out of houses in more desirable pockets.
Why Falling Prices Haven't Fixed the Problem
This is the counterintuitive core of the story: softer median values have not translated into improved affordability because loan serviceability, not purchase price alone, now determines who can buy. The report’s affordability measure is based on estimated repayments relative to income, rather than a claim that every household in a suburb has the same borrowing capacity.
Separate national figures cited in the same report, from PRD Real Estate's Australian Economic and Property Report, show mortgage repayments now consume a record 50.9 per cent of family income nationally, with the report identifying higher interest rates and growing loan sizes as pressures on affordability. PRD chief economist Dr Diaswati Mardiasmo said this is translating into longer days on market and, in some areas, softening median prices — the same dynamic playing out in Brisbane, where falling values and falling affordability are happening simultaneously rather than one offsetting the other.
This matters for how borrowers should think about APRA's macroprudential settings. Serviceability buffers assessed under the APRA Lending Restrictions and Macroprudential Policy framework require lenders to test a borrower's capacity to repay at rates well above the advertised rate. When variable rates sit near current levels, serviceability buffers push the effective qualifying rate substantially higher for many applicants — a bar that locks out households even in suburbs where sticker prices have fallen.
What the Nationwide Picture Shows
Brisbane's fall is not isolated. Nationwide, couples earning two average salaries could afford at least one property type — mostly units — in only 38.61 per cent of suburbs, down from 53.63 per cent a year ago, according to the Compare the Market data. That nationwide decline of roughly 15 percentage points in a single year signals the affordability squeeze is a structural, rate-driven phenomenon rather than a Brisbane-specific anomaly.
What It Means for Buyers, Owners and Investors
For couples still house-hunting in Brisbane, the practical message is that geography now matters more than timing. The cheapest remaining options for houses sit well outside the inner ring — Russell Island, with a median value of $537,963 and monthly repayments of $2,627, Macleay Island at $607,960, and regional Toogoolawah at $615,770, according to the Compare the Market data cited in the report. For units, Logan Central, Woodridge and Slacks Creek remain under $600,000 and within reach for dual-income couples.
For existing owners, the PRD figures showing mortgage repayments consuming 50.9 per cent of family income nationally is a warning about resilience, not just affordability at the point of purchase. Winter's observation that there is "very little wiggle room" between income and repayments if one partner loses a job or takes a career break is a direct call to stress-test household budgets against job loss or income interruption, not just against the current rate. Buyers should model their borrowing capacity and understand their serviceability position before committing to a purchase near their maximum serviceable limit.
How to interpret the affordability measure
APF analysis: A suburb-level result based on median prices and earnings is a screening tool, not an individual loan approval. The study assumes an 80 per cent loan-to-value ratio and treats repayments above 30 per cent of income as unaffordable. A buyer with a different deposit or income may therefore reach a different result. The reported decline from 43.43 per cent to 12.76 per cent describes the share of suburbs passing that test; it is not a fall in Brisbane property values of that size.
This article was produced with AI assistance and reviewed for accuracy. Content is for informational purposes only and does not constitute financial or property investment advice.